Research Areas
Research Projects
PROJECT CONTACT
Tom Bukiewicz, Ph.D.
Research Assistant Professor
VisLab Director
603.862.3289 tel
603.862.0839 fax
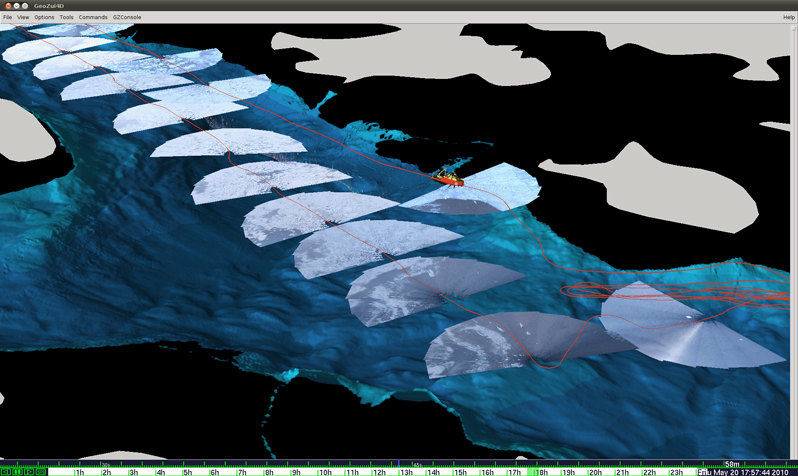
Data Visualization
At CCOM/JHC, data visualization research is conducted by the Data Visualization Research Lab. The lab has the goal of carrying out research into advanced interactive visualization with a special interest in techniques that can be applied to ocean mapping and ocean technologies in general. Currently, three broad strategies of research are the focus of the lab: the science of data visualization (experimental semiotics), tool building, and visualizations for education and outreach
Please visit the main VisLab website here.